Ethiopia
A Country tackling to end the burden of
malnutrition
About Ethiopia
MALNUTRITION CHALLENGE IN ETHIOPIA
Ethiopia in recent years has registered significant strides in addressing malnutrition in the last decade. Stunting declined from 58.0% to 38.4%, underweight from 41% to 23.6%, wasting from 12.0% to 9.9% from 2000 to 2016, while micronutrient deficiencies such as iron deficiency anemia, vitamin A and D, iodine and calcium are still at bay posing significant threat to the economy and losses of lives. Despite such progress, Ethiopia is still one of the highest contributors to the global burden of malnutrition after India, Bangladesh, Pakistan and Nigeria.

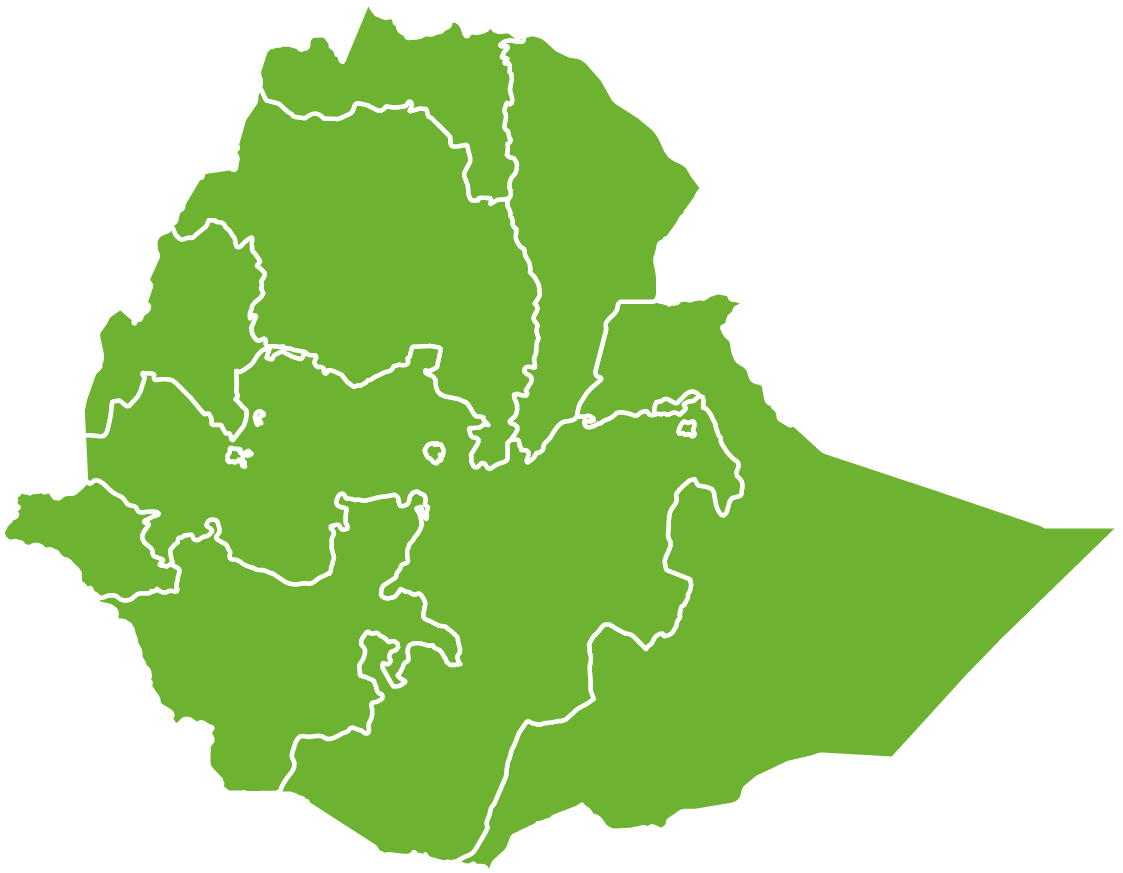
Geographical map of Ethiopia
In 2015 the African Union published a Cost of Hunger Report which estimated the annual cost of under nutrition to the Country at ETB 55.5B (USD 4.7B) which is equivalent to 16.5% of GDP. More concerted effort and unbent resolve need to continue to reduce the high levels of malnutrition in the country. The private sector as one of the key players in the food sector has an important role to play in such an effort. To date, such sectors, which process, store, pack, label and distribute food, are missing from the public discourse to address malnutrition. There are no effective platforms to date, that engage the private sector to address the high levels of malnutrition in the country.
It is for the very above reason of involving the private sector, that GAIN has launched its global program in Ethiopia called the Scaling Up Nutrition Business Network (SBN) in 2021 to continue contributing to supporting this significant stride the country is undertaking.
The Malnutrition Burden in Ethiopia
STATISTICS AND FIGURES
%
Under Five Stunting
%
Under Five Wasting
%
Under Five Overweight
%
0-5 Months Exclusive Breastfeeding
%
Woman Anemia 15-49 years
%
Adolescent Overweight Male
%
Adolescent Overweight Female
%
Adult Overweight Male
%
Adult Overweight Female
%
Adult Obesity Male
%
Adult Obesity Female
%
Adult Diabetes Male
%


